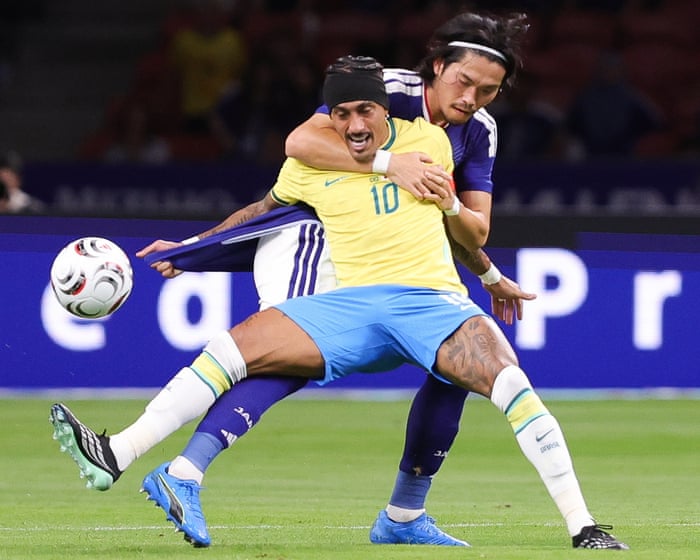
Japan beat Brazil 3-2. Japan controlled the game from 15′ to 24′ and led 2-1 at half-time. Brazil kept pace through two goals from Vinícius Júnior, but Tatsuhiro Sakamoto scored the winner at 90+1′.
Written Sun 15/11 15:31 · Auto-written (LLM) — only published if every figure matches the match stats
Spotted an error in the match info?
Timeline
23 events
SummaryRule-based lines
흐름 장악 — Japan 15′~24′ (10분).
Winning goal at 90+1′ — T. Sakamoto.
Sentences generated from the stats by fixed rules — the same stats always produce the same sentence.
Japan Brazil● Goal · ■ Red card · ▮ Yellow card · × Missed penaltyBars = momentum per minute · In-house calculation (home above, away below)Hatched = not measured
15′ T. Kubo
19′ K. Nakamura
33′ Vinicius Junior
75′ Vinicius Junior
90+1′ T. Sakamoto
View as table
Momentum and goals by 15-minute period
Period
Home share of momentum
Goals Japan
Goals Brazil
0′–15′
100%
1
0
15′–30′
100%
1
0
30′–45′
0%
0
1
45′–60′
–
0
0
60′–75′
0%
0
1
75′–90′
41%
1
0
How to read · Formula
xG (expected goals) is the sum of the probabilities of each shot being scored. Higher than actual goals means poor finishing; lower means few chances were taken well.
Momentum — In-house calculation · An event at minute t is added over minutes t~t+5 with weight w×(1−k/6): goal 1.0 · own goal 0.5 · missed penalty 0.8 · opposition yellow card 0.25 · opposition red card 0.5. Value = home − away. Momentum control is recorded when |value| ≥ 0.15 in the same direction for at least 10 minutes. (Only goal and card events are used, as the provider does not supply minute-by-minute shots or corners)
Source: API-Football (scores, events, team stats, xG). Momentum is calculated by this site.
Security were called upon to de-escalate matters late into Brazil's shock 3-2 loss to Japan on Saturday, when Jansen Foo Chuan Hui sent off Carlo Ancelotti and one of his key players
Brazil loss in Singapore marred by unruly end to friendly Argentina beaten 2-1 by Uruguay in Buenos Aires Raphinha was sent off as Brazil crashed to a 3-2 defeat by Japan in their international friendly in Singapore. The Barcelona captain had been substituted after 71 minutes…